- Регистрация
- 9 Май 2015
- Сообщения
- 1,486
- Баллы
- 155
Heatmaps are a powerful way to visualize data, revealing patterns that might not be immediately obvious in raw data. With , adding a heatmap to your application is straightforward and flexible. This blog post will guide you through the process of creating a heatmap using the AddHeatMap method.
What is a Heatmap?
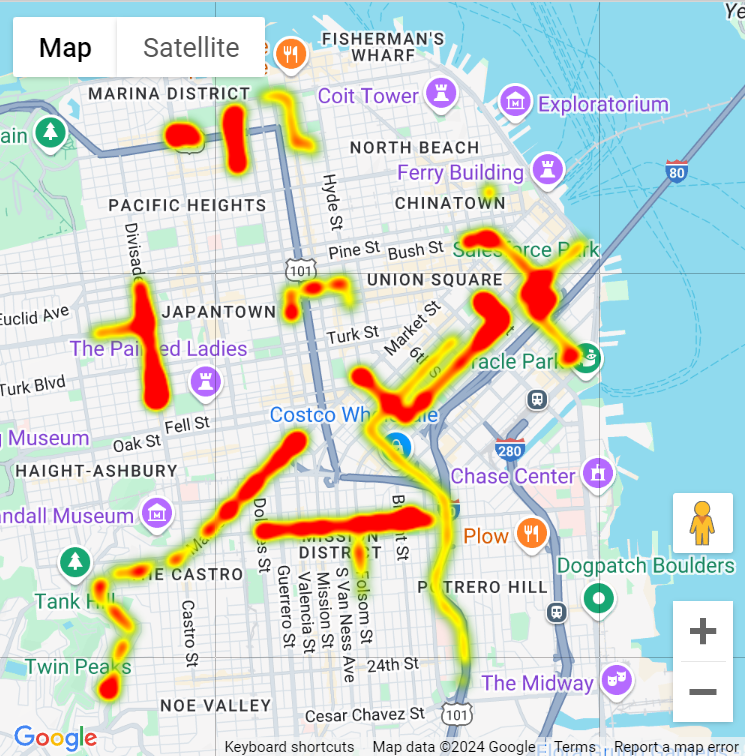
A heatmap displays data points using varying colors to represent different values. In TMS FNC Maps, each data point can have an optional weight value, which intensifies the color representation, making it easier to identify areas of higher density or importance.
Adding a Heatmap to your Map
To display a heatmap, you need an array of coordinates. Each coordinate will act as a data point on the map. Here's a basic example:
var
ca: TTMSFNCMapsCoordinateRecArray;
hm: TTMSFNCMapsHeatMap;
begin
SetLength(ca, 2);
ca[0].Latitude := 37.782551;
ca[0].Longitude := -122.445368;
//Optional setting
ca[0].Weight := 1;
//
ca[1].Latitude := 37.782745;
ca[1].Longitude := -122.444586;
//Optional setting
ca[1].Weight := 1;
//
TMSFNCGoogleMaps1.BeginUpdate;
hm := TMSFNCGoogleMaps1.AddHeatMap(ca);
//Optional settings
hm.Opacity := 1;
hm.GradientStartColor := gcGreen;
hm.GradientMidColor := gcYellow;
hm.GradientEndColor := gcRed;
//
TMSFNCGoogleMaps1.EndUpdate;
end;
Customizing Your Heatmap
You can adjust the data point weight, opacity and gradient colors to match your specific visualization needs.
Key Parameters
Supported Mapping Services
The Heatmaps functionality is supported by the following mapping services:
 Google Maps
 HERE Maps
 OpenLayers
 Leaflet
Conclusion
Heatmaps are a great way to represent complex data visually. With , you can easily add and customize heatmaps to enhance your application's data visualization capabilities. Whether you're highlighting high-density areas or showing patterns over a geographic region, heatmaps can make your data more accessible and easier to understand.
Available Now
Ready to enhance your project with powerful mapping visualizations using ?
Download the latest version of and get started today!
What is a Heatmap?
A heatmap displays data points using varying colors to represent different values. In TMS FNC Maps, each data point can have an optional weight value, which intensifies the color representation, making it easier to identify areas of higher density or importance.
Adding a Heatmap to your Map
To display a heatmap, you need an array of coordinates. Each coordinate will act as a data point on the map. Here's a basic example:
var
ca: TTMSFNCMapsCoordinateRecArray;
hm: TTMSFNCMapsHeatMap;
begin
SetLength(ca, 2);
ca[0].Latitude := 37.782551;
ca[0].Longitude := -122.445368;
//Optional setting
ca[0].Weight := 1;
//
ca[1].Latitude := 37.782745;
ca[1].Longitude := -122.444586;
//Optional setting
ca[1].Weight := 1;
//
TMSFNCGoogleMaps1.BeginUpdate;
hm := TMSFNCGoogleMaps1.AddHeatMap(ca);
//Optional settings
hm.Opacity := 1;
hm.GradientStartColor := gcGreen;
hm.GradientMidColor := gcYellow;
hm.GradientEndColor := gcRed;
//
TMSFNCGoogleMaps1.EndUpdate;
end;
Customizing Your Heatmap
You can adjust the data point weight, opacity and gradient colors to match your specific visualization needs.
Key Parameters
Coordinates: An array where each entry represents a data point.
Weight: Optional; a weight value that affects the intensity of the data point.
Opacity: Adjusts the transparency of the heatmap.
Gradient Colors: Define the start, mid, and end colors for the heatmap gradient, enabling smooth transitions between colors.
Supported Mapping Services
The Heatmaps functionality is supported by the following mapping services:
Conclusion
Heatmaps are a great way to represent complex data visually. With , you can easily add and customize heatmaps to enhance your application's data visualization capabilities. Whether you're highlighting high-density areas or showing patterns over a geographic region, heatmaps can make your data more accessible and easier to understand.
Available Now
Ready to enhance your project with powerful mapping visualizations using ?
Download the latest version of and get started today!