- Регистрация
- 9 Май 2015
- Сообщения
- 1,480
- Баллы
- 155
AI-powered HTML Reports with Embedded Browser Visualization
In our , we introduced the concept of toolsets in and how they can be used to extend AI-assisted workflows in Delphi or C++Builder applications. We demonstrated how toolsets allow seamless integration between AI-powered functionality and application-specific features.
In this follow-up, we take the concept further by showing how you can use AI to generate HTML reports enriched with Google Charts and visualize them directly inside your Delphi application using the TTMSFNCWebBrowser. Imagine the sheer power you give in the hands of your software users to generate the reports they want in the format they want with minimum effort.
Introducing the Browser Toolset
To bridge the gap between an AI-generated HTML report and an embedded browser in Delphi, here the TTMSFNCWebBrowser from , we introduce a new toolset:
TTMSMCPCloudAIBrowser = class(TTMSMCPCloudAIToolSet)
private
FBrowser: TTMSFNCWebBrowser;
protected
procedure DoLoadHTML(Sender: TObject; Args: TJSONObject; var Result: string);
public
procedure DefineTools; override;
property Browser: TTMSFNCWebBrowser read FBrowser write FBrowser;
end;
This toolset exposes a LoadHTML tool to the AI engine, allowing it to dynamically generate and render HTML content within the application. The tool definition looks like this:
procedure TTMSMCPCloudAIBrowser.DefineTools;
var
tool: TTMSMCPCloudAITool;
p: TTMSMCPCloudAIParameter;
begin
inherited;
BeginUpdate;
tool := Tools.Add;
tool.Description := 'load and show HTML into the browser';
tool.Name := 'LoadHTML';
p := tool.Parameters.Add;
p.Description := 'the HTML to load into the browser';
p.&Type := ptString;
p.Required := true;
p.Name := 'html';
p.Description := 'string of the HTML/JavaScript that was generated for the browser';
tool.OnExecute := DoLoadHTML;
EndUpdate;
end;
With this setup, your application can act as a host for HTML reports, combining AI-generated text and data visualizations.
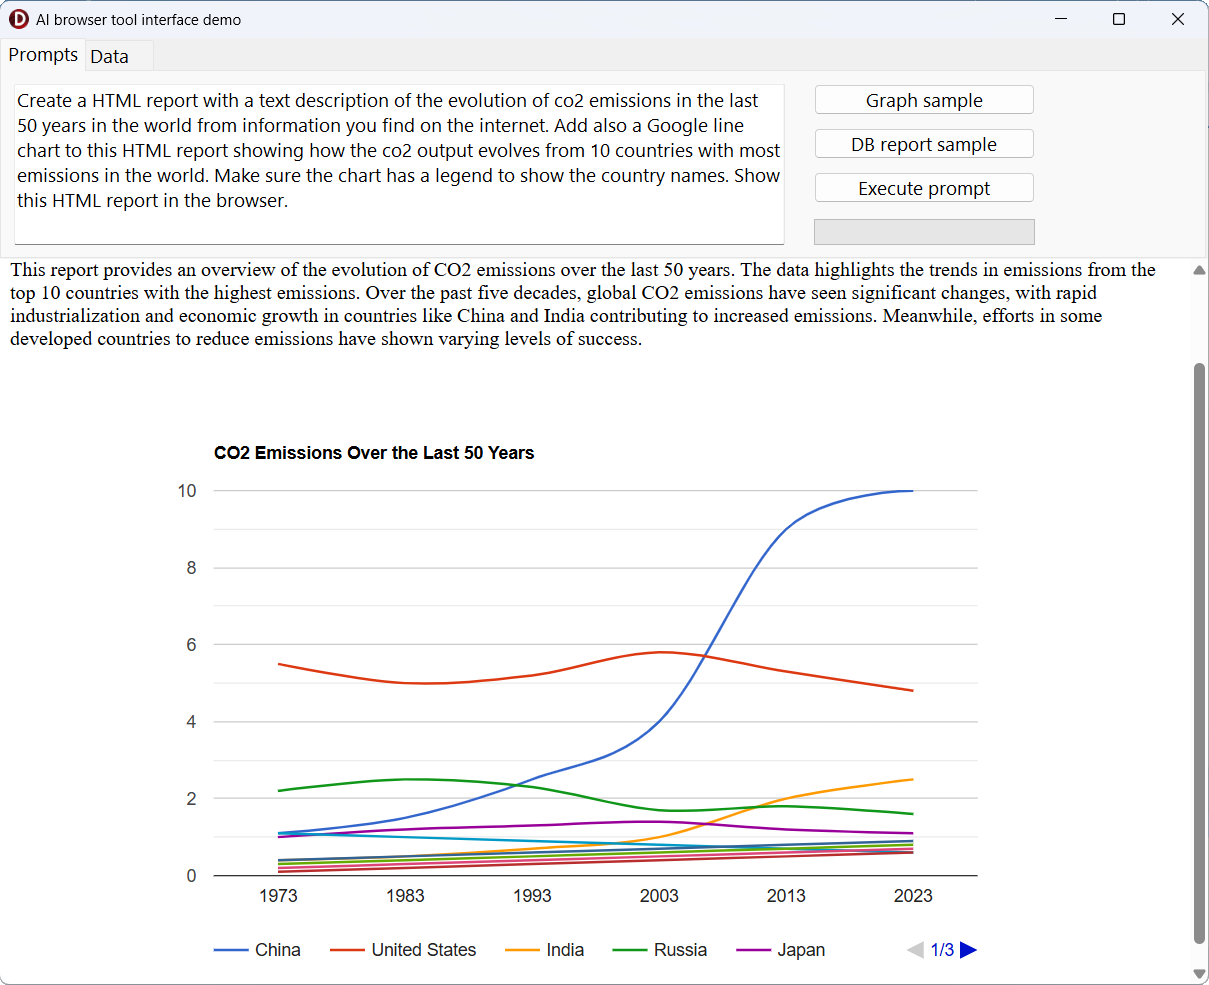
Example 1: Global CO₂ Emissions Report
Using a natural language prompt, we can instruct the AI to generate both descriptive text and a Google Chart inside an HTML page:
Prompt:
Example 2: Dataset-driven Report
We can also combine this with the TTMSMCPCloudAIDataSet toolset to allow AI to directly process and visualize application data.
Prompt:
Unlocking Interactive AI-powered Dashboards
With these building blocks in place, Delphi and C++Builder developers can now:
This architecture makes it possible to build interactive dashboards powered by AI, blending the strengths of Delphi applications with dynamic web-based visualizations.
Download & play
If you have TMS AI Studio installed and TMS FNC Core, go ahead and download the full source code of this example application and you can play and modify it yourself. Let yourself be inspired on how to add additional AI flexibility in your own applications.
Whats Next?
The combination of toolsets, HTML generation, and embedded browsing opens the door to countless possibilities: AI-generated dashboards, reporting assistants, live dataset analysis, and much more.
In upcoming posts, well continue to expand on this concept, exploring multi-tool workflows and domain-specific integrations.
 What kind of AI-generated reports or AI based interactions would you like to see integrated into Delphi applications?

In our , we introduced the concept of toolsets in and how they can be used to extend AI-assisted workflows in Delphi or C++Builder applications. We demonstrated how toolsets allow seamless integration between AI-powered functionality and application-specific features.
In this follow-up, we take the concept further by showing how you can use AI to generate HTML reports enriched with Google Charts and visualize them directly inside your Delphi application using the TTMSFNCWebBrowser. Imagine the sheer power you give in the hands of your software users to generate the reports they want in the format they want with minimum effort.
Introducing the Browser Toolset
To bridge the gap between an AI-generated HTML report and an embedded browser in Delphi, here the TTMSFNCWebBrowser from , we introduce a new toolset:
TTMSMCPCloudAIBrowser = class(TTMSMCPCloudAIToolSet)
private
FBrowser: TTMSFNCWebBrowser;
protected
procedure DoLoadHTML(Sender: TObject; Args: TJSONObject; var Result: string);
public
procedure DefineTools; override;
property Browser: TTMSFNCWebBrowser read FBrowser write FBrowser;
end;
This toolset exposes a LoadHTML tool to the AI engine, allowing it to dynamically generate and render HTML content within the application. The tool definition looks like this:
procedure TTMSMCPCloudAIBrowser.DefineTools;
var
tool: TTMSMCPCloudAITool;
p: TTMSMCPCloudAIParameter;
begin
inherited;
BeginUpdate;
tool := Tools.Add;
tool.Description := 'load and show HTML into the browser';
tool.Name := 'LoadHTML';
p := tool.Parameters.Add;
p.Description := 'the HTML to load into the browser';
p.&Type := ptString;
p.Required := true;
p.Name := 'html';
p.Description := 'string of the HTML/JavaScript that was generated for the browser';
tool.OnExecute := DoLoadHTML;
EndUpdate;
end;
With this setup, your application can act as a host for HTML reports, combining AI-generated text and data visualizations.
Example 1: Global CO₂ Emissions Report
Using a natural language prompt, we can instruct the AI to generate both descriptive text and a Google Chart inside an HTML page:
Prompt:
The AI responds by producing an HTML file with a Bootstrap-styled layout and a Google Line Chart showing emission trends. The LoadHTML toolset then automatically loads this HTML into the embedded browser for interactive visualization.Create a HTML report with a text description of the evolution of co2 emissions in the last 50 years in the world from information you find on the internet. Add also a Google line chart to this HTML report showing how the co2 output evolves from 10 countries with most emissions in the world. Make sure the chart has a legend to show the country names. Show this HTML report in the browser.
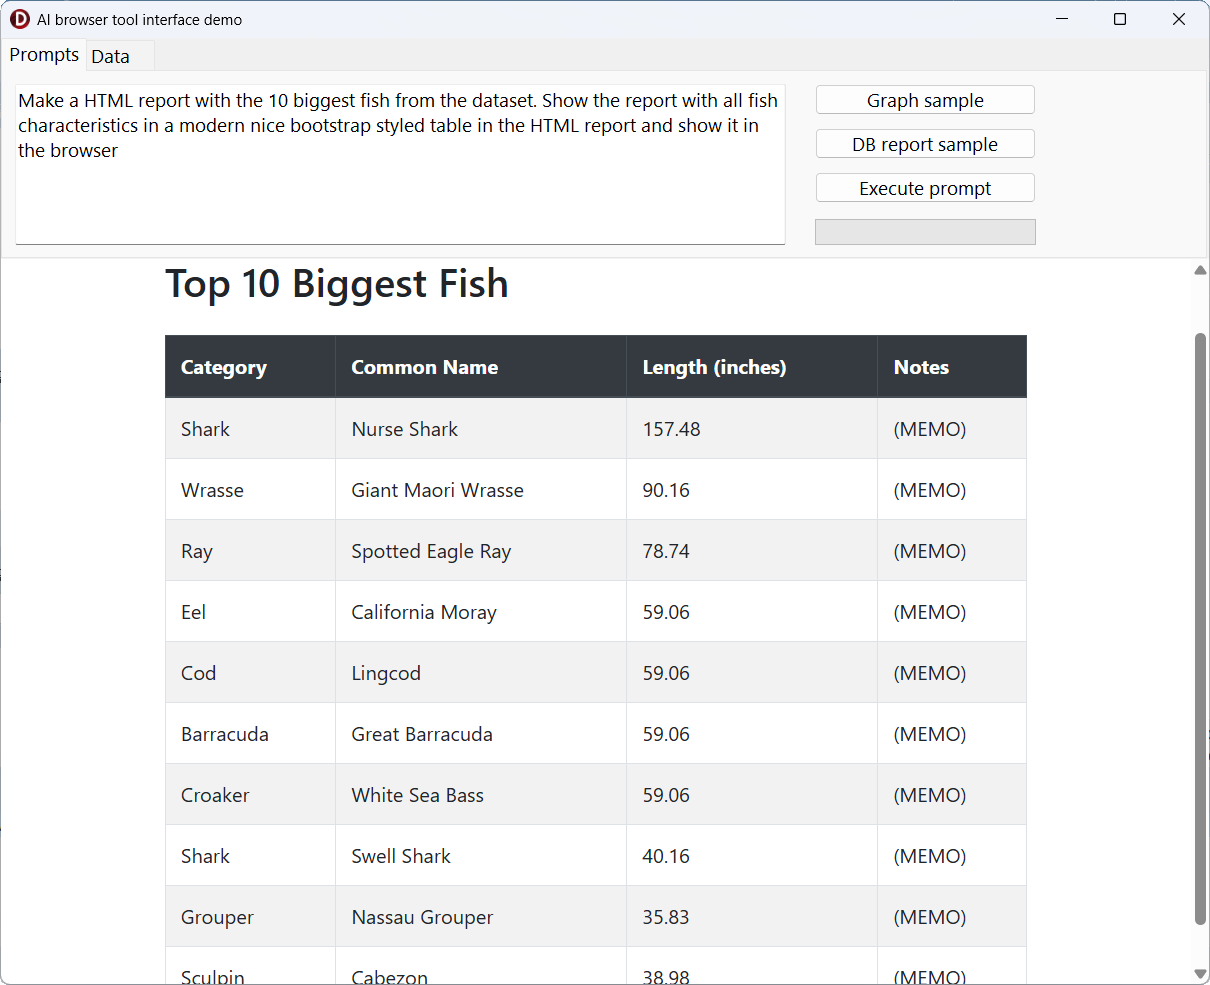
Example 2: Dataset-driven Report
We can also combine this with the TTMSMCPCloudAIDataSet toolset to allow AI to directly process and visualize application data.
Prompt:
Here, the dataset toolset provides structured data (fish size, weight, habitat, etc.), while the AI generates a fully formatted Bootstrap HTML table. The browser toolset then takes over to present the result inside the Delphi application.Make a HTML report with the 10 biggest fish from the dataset. Show the report with all fish characteristics in a modern nice Bootstrap styled table in the HTML and show it in the browser.
Unlocking Interactive AI-powered Dashboards
With these building blocks in place, Delphi and C++Builder developers can now:
Create data-driven HTML reports directly from datasets.
Enhance reports with Google Charts and modern Bootstrap styling.
Display these reports seamlessly inside applications using the embedded browser.
This architecture makes it possible to build interactive dashboards powered by AI, blending the strengths of Delphi applications with dynamic web-based visualizations.
Download & play
If you have TMS AI Studio installed and TMS FNC Core, go ahead and download the full source code of this example application and you can play and modify it yourself. Let yourself be inspired on how to add additional AI flexibility in your own applications.
Whats Next?
The combination of toolsets, HTML generation, and embedded browsing opens the door to countless possibilities: AI-generated dashboards, reporting assistants, live dataset analysis, and much more.
In upcoming posts, well continue to expand on this concept, exploring multi-tool workflows and domain-specific integrations.
What kind of AI-generated reports or AI based interactions would you like to see integrated into Delphi applications?Источник: